Bitcoin Price Analysis Today: BTC Tests $63.7K
Introduction: the market is soft, but the chart is not broken yet
Bitcoin price analysis today starts with a clean split in the evidence. BTC is trading near $64,000 after a 1.7% 24-hour decline, while the seven-day return is still slightly positive. Ethereum is down less on the day but has the higher measured volatility. Sentiment is fearful, ETF flows turned negative, and a Federal Reserve meeting sits ahead. That is a pressure setup, not proof of a new bear trend.
This report separates confirmed readings from interpretation. It asks what pushed the market lower, which technical levels matter, and what would invalidate the current explanation. It is market journalism and education, not personalised financial advice.
Latest crypto market data at 03:02 UTC
CoinGecko’s public API returned the following snapshot on July 25. Prices, market caps, volumes, and percentage changes move continuously, so the timestamp matters.
| Asset or measure | Price / reading | 24h | 7d | Market cap / volume |
|---|---|---|---|---|
| Bitcoin (BTC) | $63,971 | −1.7% | +0.1% | $1.283T / $26.34B |
| Ethereum (ETH) | $1,856.80 | −0.8% | +0.8% | $224.07B / $7.40B |
| Total crypto market | — | −1.15% | — | $2.271T / $62.76B volume |
| Bitcoin dominance | — | — | — | 56.50% |
| Fear & Greed Index | 27 | — | — | Fear |
The split is worth watching. BTC is carrying the larger daily loss, yet ETH is still up more over seven days. Bitcoin dominance is high, which usually means capital is staying closer to the largest asset while traders reduce exposure to smaller tokens. That is an observation, not proof that investors are treating Bitcoin as a safe haven.
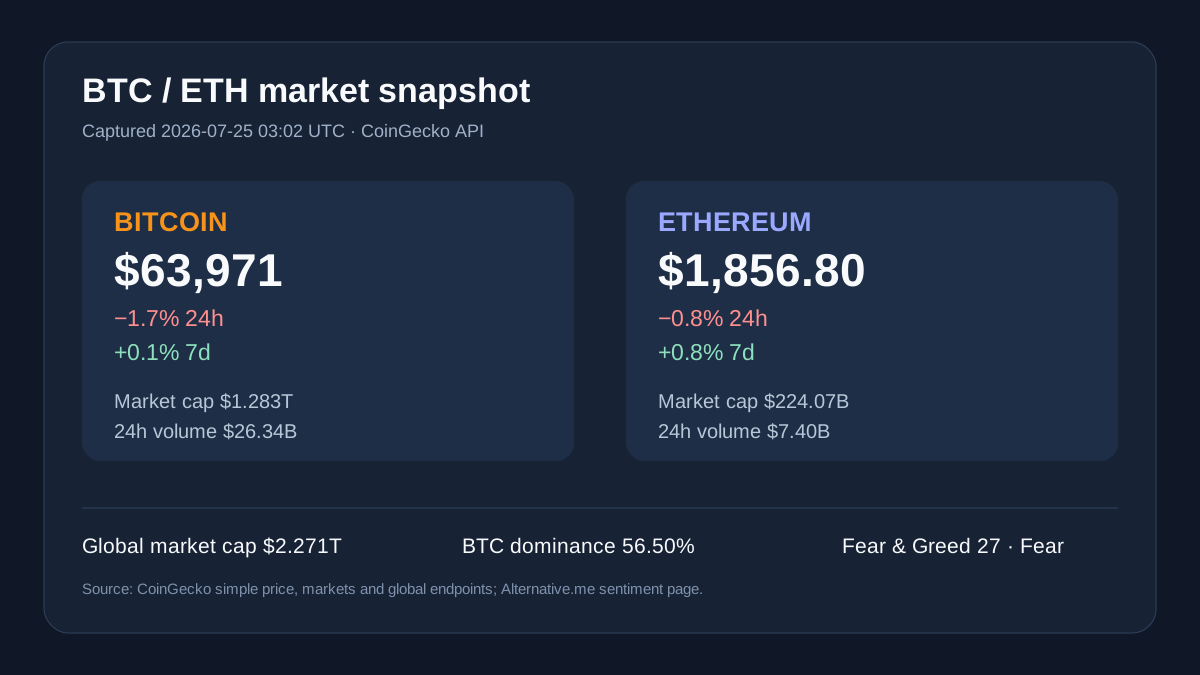
Figure 1. Source-attributed snapshot based on CoinGecko API responses captured around 03:02 UTC and Alternative.me’s Fear & Greed page captured around 03:04 UTC. Canonical sources: CoinGecko Bitcoin, CoinGecko Ethereum, and Alternative.me Fear & Greed.
What is behind the BTC and ETH move?
The best-supported explanation is a mix of ETF selling, a technical rejection near the top of the recent range, and macro caution before the July 28–29 FOMC meeting. None of those facts proves a single cause.
- Spot Bitcoin ETF flows turned negative. Farside Investors data cited in the market search showed a $225.18 million net outflow from U.S.-listed spot Bitcoin ETFs on July 24, ending a seven-day run of positive flows. BlackRock’s IBIT accounted for a reported $202.5 million outflow. This is a direct flow observation; it does not prove that ETF selling caused every spot-market move.
- The Fed decision is close. The Federal Reserve’s July Monetary Policy Report says the target range has been 3.50%–3.75% since the start of the year. The July meeting is scheduled for July 28–29. With June CPI at 3.5% year over year and core CPI at 2.6%, traders have a reason to keep rate-sensitive risk positions smaller, but the upcoming decision has not happened yet.
- Oil keeps inflation in the conversation. Search results put WTI around $90.47 and Brent near $90.04 on July 24–25. Energy prices can affect inflation expectations and bond yields. The current evidence supports a macro risk channel, not a claim that oil alone drove BTC lower.
- Stocks did not confirm a broad Friday panic. The latest search snapshot showed the Dow at 51,995.99, up 0.55%; the S&P 500 at 7,440.73, up 0.44%; and the Nasdaq at 25,100.54, down 0.15%. That mixed session weakens the simple “stocks fell, so crypto fell” story.
The practical conclusion is modest: ETF outflows and a nearby Fed event are confirmed context, while causation remains probabilistic. A rebound in ETF flows with BTC holding support would weaken the selling explanation. A fresh outflow day combined with a close below support would strengthen it.
Volatility and technical context
I calculated the indicators below from CoinGecko’s 90-day daily price and volume series fetched after the market snapshot. These are daily-close calculations, not exchange-native intraday signals. The Bollinger Bands use a 20-day simple average and two standard deviations. Annualized realized volatility uses the last 30 daily log returns.
Bitcoin: below its 20-day average, but close to the middle of its band
BTC’s 14-day RSI is 50.89. That is neutral, not oversold. The daily MACD is about +384.04, with a signal line near +323.82 and a histogram around +60.22. Momentum remains positive in this daily sample even as price is under pressure in the latest session.
The 20-day simple moving average is about $64,223. The 20-day Bollinger range runs from roughly $62,125 to $66,322. Today’s API range was $63,700–$65,745, so the lower intraday print is the first support test while $65,745 is the immediate resistance reference. A sustained close under $62,125 would be a deeper band failure; a close above $66,322 would put the upper band back in play.
Thirty-day annualized realized volatility is about 29.6%. Latest daily volume near $26.31 billion is slightly below the 20-day average near $26.74 billion. The decline therefore lacks strong volume confirmation in this data set. That does not make the move safe; it means the breakdown case needs follow-through.
Ethereum: higher volatility and a nearly flat MACD spread
ETH’s 14-day RSI is 58.08, still below a typical overbought threshold. Its daily MACD is about +37.78 against a signal near +37.81, leaving a histogram near −0.03. That is effectively flat at the precision of this snapshot. It supports caution, not a strong directional call.
ETH’s 20-day average is near $1,841. The 20-day Bollinger range is roughly $1,724–$1,958. The current 24-hour low near $1,848 is close to the moving average, while $1,907 is the immediate recovery reference and $1,958 is the upper-band area.
ETH’s 30-day annualized realized volatility is about 42.4%, well above Bitcoin’s 29.6%. Its latest daily volume near $8.01 billion is below the 20-day average near $9.72 billion. Higher realized volatility explains why ETH can produce larger percentage swings, but it does not identify the cause of today’s move.
No bullish or bearish divergence is claimed. The daily sample supports RSI, MACD, average, band, and realized-volatility readings, but it does not provide a clean divergence signal that deserves a headline.
Trading implications for informed readers
- Set the invalidation point first. For BTC, $63,700 is the near-term range floor and $62,125 is the lower daily band. For ETH, $1,848 is the current low and $1,841 is the 20-day average. A brief wick through a level is different from a daily close below it.
- Size for the higher-volatility asset. ETH’s measured realized volatility is about 13 percentage points above BTC’s. Equal dollar positions do not carry equal movement risk.
- Demand price and volume agreement. A BTC recovery through $66,322 with volume above its recent average would carry more information than a thin overnight bounce. A break below $62,125 with expanding volume would make the bearish case stronger.
- Watch the ETF flow reaction. Another large outflow day would add weight to the distribution view. A return to inflows would weaken it. Flow data is a context tool, not a trade trigger.
- Keep macro and crypto clocks separate. The Fed meeting, CPI interpretation, oil, and yields can change risk appetite. A chart pattern cannot tell you which policy message is coming.
Use the Bitcoin coin page, Bitcoin volatility calculator, and cryptocurrency volatility comparison for additional research context. You can also return to the LiveVolatile blog for later snapshots.
FAQ
Why is Bitcoin down today?
Bitcoin is down about 1.7% over 24 hours in the CoinGecko snapshot. The best-supported context includes a reported $225.18 million U.S. spot Bitcoin ETF outflow on July 24, technical pressure near the upper recent range, and caution before the July 28–29 Fed meeting. Those factors align, but none proves sole causation.
Is Bitcoin in a confirmed downtrend?
Not from this snapshot alone. BTC is below its 20-day average near $64,223 and has tested $63,700, yet its seven-day return is still about +0.1%, daily MACD remains slightly positive, and volume is below its 20-day average. A close below $62,125 with expanding volume would provide stronger confirmation.
What does Fear & Greed at 27 mean?
Alternative.me classifies 27 as Fear. The index combines inputs such as volatility, market momentum and volume, social activity, dominance, and search trends. It describes sentiment rather than forecasting price. Fear can persist during a falling market or appear before a rebound, so it should sit beside price and risk limits.
What are the key BTC and ETH levels today?
BTC’s first range references are $63,700 support and $65,745 resistance, with the 20-day band spanning about $62,125–$66,322. ETH’s current range references are $1,848 and $1,907, with its 20-day band near $1,724–$1,958. These are observed levels, not guarantees or personalised recommendations.
Conclusion: the next move needs confirmation
Today’s crypto market volatility is real, but the data does not describe a confirmed liquidation cascade. ETF outflows are a verified pressure point. Fear is high. The Fed meeting is close. Yet stocks were mixed rather than uniformly weak, BTC’s daily momentum is not deeply negative, and volume has not expanded enough to confirm a disorderly break.
The next useful signal is agreement. A recovery above resistance with stronger volume would challenge the bearish case. A support break with broader market weakness and another ETF outflow would support it. Until one of those paths develops, treat the explanation as a working hypothesis and keep risk small enough to survive being wrong.
Sources
- CoinGecko markets API, global API, BTC 90-day market chart, and ETH 90-day market chart, captured around 2026-07-25 03:02 UTC.
- Alternative.me Fear & Greed Index, captured around 2026-07-25 03:04 UTC.
- Farside Investors ETF flow data, July 24 flow figure reported in search results; page access was rate-limited during this run.
- Federal Reserve July 2026 Monetary Policy Report and FOMC calendar.
- Bureau of Labor Statistics June 2026 CPI.
- Fox Business markets snapshot, Trading Economics WTI, and Trading Economics Brent.
Final data timestamp: 2026-07-25 03:08 UTC. This is market journalism and education, not personalised financial advice.
— Marcus Reynolds, Senior Crypto Volatility Analyst