Bitcoin and Ethereum Market Move: July 28, 2026
Bitcoin price today is $63,130 and Ethereum price today is $1,873.80 in a CoinGecko API snapshot taken at 03:03 UTC on July 28, 2026. Both large-cap assets are lower over 24 hours and seven days. The move is broad: total crypto market capitalization is down 2.78% over 24 hours while reported market volume is up 56.05%. That combination points to active repricing, not a quiet drift.
This is a market explanation, not a call to buy or sell. Crypto trades around the clock, so every price and percentage below is tied to the stated UTC timestamp.
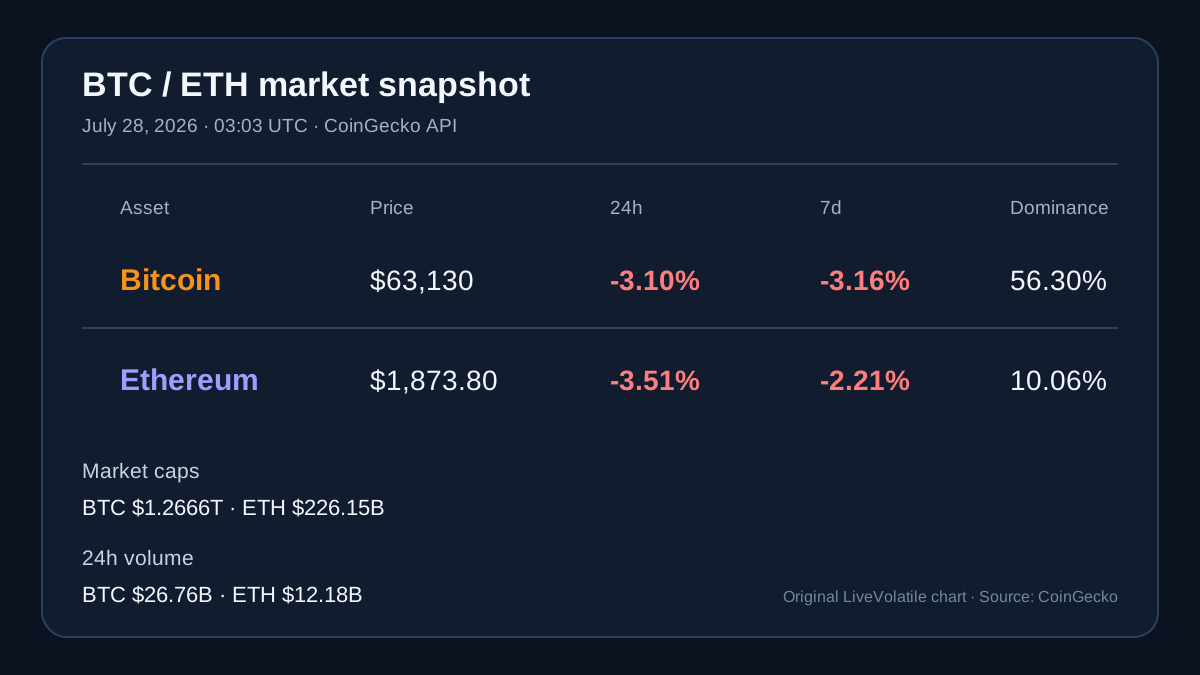
Original chart by LiveVolatile using the CoinGecko markets endpoint and global market endpoint, retrieved at 03:03 UTC on July 28, 2026.
BTC and ETH market snapshot at 03:03 UTC
| Metric | Bitcoin (BTC) | Ethereum (ETH) |
|---|---|---|
| Price | $63,130 | $1,873.80 |
| 24-hour change | -3.10% | -3.51% |
| 7-day change | -3.16% | -2.21% |
| Market cap | $1.2666 trillion | $226.15 billion |
| 24-hour volume | $26.76 billion | $12.18 billion |
| Market dominance | 56.30% | 10.06% |
| 24-hour low / high | $63,055 / $65,546 | $1,868.67 / $1,972.61 |
Bitcoin remains the market’s main liquidity anchor, with more than half of total crypto market value. Ethereum has a smaller share, yet its 24-hour volume is equal to about 45.5% of Bitcoin’s in this snapshot. ETH’s 3.51% daily decline is also a little deeper than BTC’s 3.10% slide, while ETH’s seven-day loss is smaller. That split suggests a short-term selloff across both assets rather than a clean one-way rotation out of ETH.
The wider market was valued at about $2.249 trillion. Global crypto volume was about $68.67 billion, and the market-cap change was negative even as volume expanded. Volume alone does not identify buyers or sellers, but a volume jump alongside falling prices tells us that participation and forced repositioning deserve attention.
What moved the market?
The observed fact: a broad risk reduction
The verified data shows simultaneous declines in BTC, ETH, total market capitalization, and the two largest asset classes by value. It does not, by itself, prove one headline caused the move. There was no primary source at the snapshot time that assigned the drop to a single liquidation, ETF flow, or policy statement. The responsible conclusion is that crypto was being repriced lower while trading activity rose.
The scheduled macro risk: the Federal Reserve meeting
The Federal Open Market Committee is scheduled to meet on July 28–29, 2026, according to the Federal Reserve’s FOMC calendar. At 03:03 UTC, the meeting outcome was not available. That creates an event-risk window for Bitcoin and Ethereum because interest-rate expectations can change the value investors place on assets with no cash yield.
This is context, not proof of causation. Traders may reduce exposure before a rate decision, widen risk limits, or wait for the statement and press conference. A later move after the decision would still need to be checked against the release time, Treasury yields, the dollar, and equity-market behavior before calling the Fed the cause.
ETF flows and headlines: a data gap
Search results around July 27 contained conflicting summaries of U.S. spot ETF flows. The direct daily flow files were not available in a form I could verify at this snapshot time, so this report does not attach a flow number to the price decline. That omission is deliberate. A plausible story is not the same as a sourced reason.
Technical context without false precision
The last seven days of hourly CoinGecko prices produced a range of approximately $63,128 to $66,803 for BTC and $1,852.67 to $1,966.98 for ETH. These are observed hourly extremes, not guaranteed support or resistance levels.
BTC’s current price is about 2.96% below its seven-day hourly average of roughly $65,059. ETH is about 1.62% below its seven-day hourly average of roughly $1,904.74. Both assets are below that simple average, which describes recent weakness but does not predict a reversal.
The 24-hour ranges add a second signal. BTC traded through a range of about 3.95% from low to high, while ETH covered about 5.56%. At the snapshot, BTC was only about 3.0% above its 24-hour low and ETH about 5.5% above its low. Price was therefore sitting near the lower part of each day’s range. A recovery above the midpoint would show improved intraday demand; a fresh low would show that sellers still control the immediate range. Neither condition is a trade instruction.
For a deeper risk reading, compare this snapshot with the Bitcoin volatility calculator and the cryptocurrency volatility comparison. Those tools help put a single daily move into a wider range instead of treating one candle as a complete market thesis.
What to watch next
First, mark the Federal Reserve statement and press conference times in UTC. Second, watch whether BTC holds above the $63,055 daily low and whether ETH can stay above $1,868.67. Third, compare spot volume with derivatives positioning when a reliable feed is available. A bounce on shrinking activity would mean something different from a bounce confirmed by expanding spot demand.
The cleanest near-term setup is information, not prediction: wait for the macro event to pass, record the first reaction, then check whether price accepts the new range. If your plan cannot tolerate a move through the observed daily range, position size is too large for current conditions.
FAQs
Why are Bitcoin and Ethereum down today?
The verified snapshot confirms that both are down, but it does not prove one cause. The Federal Reserve’s July 28–29 meeting is a scheduled source of macro uncertainty. ETF-flow attribution remains a data gap at 03:03 UTC.
Is Ethereum weaker than Bitcoin?
Over 24 hours, yes: ETH is down 3.51% versus BTC down 3.10%. Over seven days, ETH is down 2.21% while BTC is down 3.16%, so the answer changes with the measurement window.
What is Bitcoin dominance today?
CoinGecko’s global snapshot puts Bitcoin dominance at 56.30% and Ethereum dominance at 10.06% at 03:03 UTC on July 28, 2026.
Should I buy the dip?
That depends on your objectives, time horizon, liquidity needs, and risk limits. This article is educational content, not personal financial advice. Use a written plan and do not risk money you cannot afford to lose.
Explore more market research
Read the latest LiveVolatile blog, open the Bitcoin page, calculate Bitcoin volatility, and compare assets in the cryptocurrency volatility research.
Educational content only — not personal financial advice.
— Marcus Reynolds, Senior Crypto Volatility Analyst