Webull Reports 300% Bitcoin and ETH Buy-Order Jump: What It Means for Crypto Volatility
Direct answer: Webull CEO Anthony Denier said on August 25, 2026 that buy-side orders for Bitcoin and ether on the platform had increased by nearly 300% over roughly the previous week and a half. He linked the change to the June 4 elimination of the Pattern Day Trader restriction, which had limited frequent trading in accounts under $25,000. The signal is relevant because it suggests a retail-access channel for crypto activity—but it is not proof that the whole market experienced a 300% demand increase, nor does it predict the next BTC or ETH move.
Key takeaways
- The nearly 300% figure is a Webull platform statistic quoted by its CEO, not an exchange-wide or industry-wide measure.
- Webull’s August 19 results release said the June 4 PDT-rule elimination helped it support unlimited day trades for eligible customers and contributed to record trading volumes.
- Webull reported $198.8 million in Q2 2026 revenue, up 51% year over year; trading-related revenue was $147.7 million. Those figures cover the whole platform, not crypto alone.
- A retail-flow burst can amplify volatility when it meets thin liquidity, derivatives leverage or crowded positioning.
- Traders should confirm the signal with spot volume, market depth, funding, open interest, liquidations and BTC/ETH relative strength.
- The prudent conclusion is “a platform-specific retail activity signal,” not “crypto demand has tripled.”
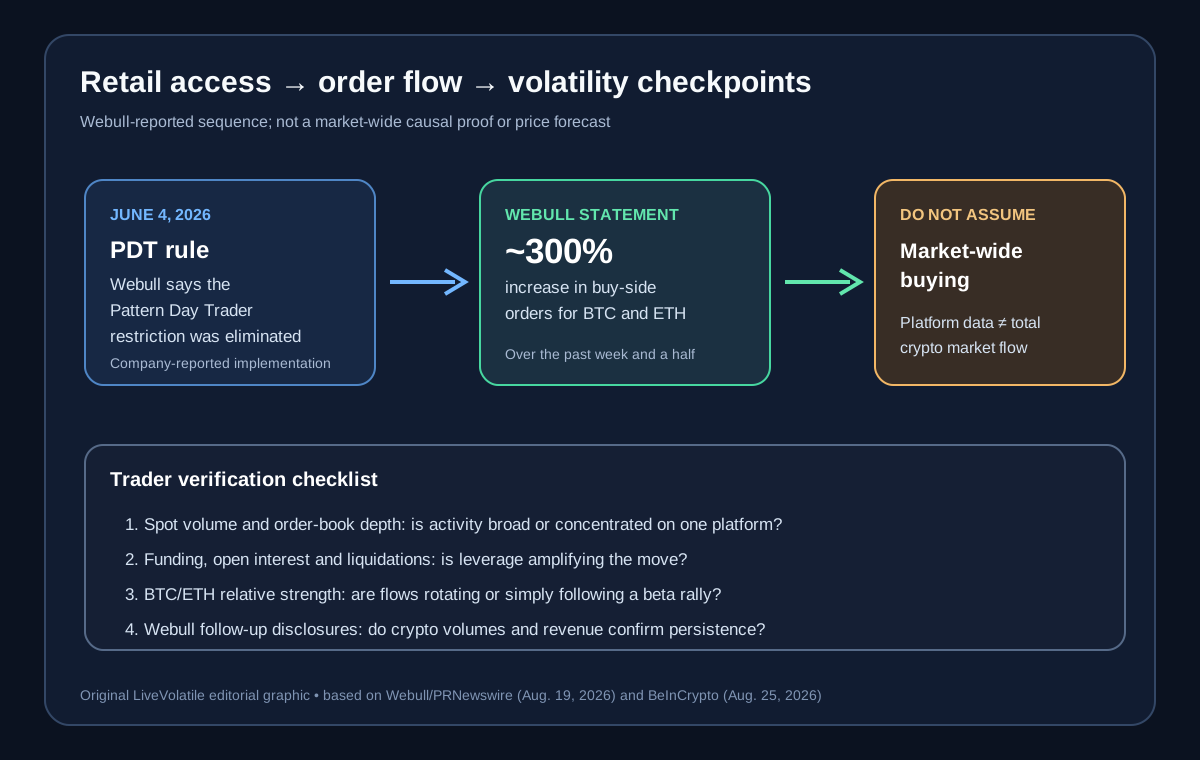
Visual credit: Original LiveVolatile editorial SVG created from Webull Corporation’s August 19, 2026 results release via PRNewswire and the August 25 BeInCrypto report. It distinguishes company-reported platform activity from market-wide verification points; it is not a price forecast.
What exactly did Webull report?
The immediate claim came from Anthony Denier, Webull’s group president and U.S. CEO, in an interview with CNBC’s Squawk on the Street, as reported by BeInCrypto. Denier said the platform was seeing “almost a 300% increase in buy-side orders” for Bitcoin and ETH over the prior week and a half. The report placed Bitcoin near $78,919 at the time of writing.
That wording matters. It refers to buy-side orders, not necessarily completed purchases, net inflows, dollar volume, unique users or market-wide spot demand. It also covers two large crypto assets on one brokerage platform. The statistic can still be useful, but only if its measurement boundaries remain visible.
Webull’s own August 19 financial-results release provides the broader company context. It said the elimination of the Pattern Day Trader rule took effect on June 4 and allowed eligible customers to place unlimited day trades. Webull reported record Q2 revenue of $198.8 million, up 51% year over year, with trading-related revenue of $147.7 million. Those numbers show that the policy change coincided with stronger activity across the platform; they do not isolate the causal contribution of crypto trading.
Why a retail-access change can matter to volatility
The PDT restriction affected accounts below the $25,000 threshold. If a brokerage removes a constraint on frequent trading, the first market impact is not necessarily a permanent increase in long-term ownership. It may instead be a change in when and how often customers can express a view.
That distinction is important for volatile crypto markets:
| Transmission channel | Possible effect | What would confirm it |
|---|---|---|
| More permitted trading frequency | Faster reaction to intraday BTC and ETH moves | Higher completed trades and turnover, not only order submissions |
| Retail momentum chasing | Short bursts of aggressive buying during breakouts | Buy imbalance alongside spot volume and breadth |
| Thin-liquidity amplification | Smaller orders move price more during stressed periods | Slippage, spread and order-book-depth data |
| Derivatives feedback | Spot buying can attract leverage and liquidations | Open interest, funding and liquidation clusters |
| Reversal risk | Fast retail inflows can unwind quickly | Net selling, falling depth and rising realized volatility |
These are mechanisms to test, not outcomes established by the Webull statistic.
The most important caveat: orders are not the market
A 300% increase sounds precise, but it does not answer several questions a volatility analyst would need to answer:
- What was the starting base?
- Did Webull measure submitted orders, executed orders or filled notional?
- Was the comparison against the prior week and a half, a historical average or another period?
- How much of the change came from Bitcoin versus ETH?
- Did customer deposits, holdings or net buying rise at the same time?
- How large is Webull’s crypto activity relative to global spot and derivatives markets?
Without those denominators, the figure is best treated as a directional activity indicator. It can tell readers that one brokerage saw a sharp change in customer behavior. It cannot establish that global crypto demand rose by the same percentage.
The company’s earnings transcript, published on Webull and attributed to Benzinga, also described crypto revenue of $2.25 million for the quarter and said the firm expected growth as coin-in and coin-out features were integrated. That is useful context, but crypto remained a small part of the reported $198.8 million total revenue. It reinforces the need not to extrapolate a single platform’s order statistic into a market-wide conclusion.
How traders should verify whether the signal is spreading
The Webull data becomes more actionable if independent market measures move in the same direction.
1. Check spot participation
Look for rising BTC and ETH spot volume across multiple venues, not just a price increase on one broker. Breadth across exchanges and regions is more informative than a single platform’s order count. If price rises while aggregate spot volume remains thin, the move may be more vulnerable to slippage and reversal.
2. Check market depth and spreads
Retail buying can amplify price movement when resting liquidity is shallow. Compare bid-ask spreads, depth near the mid-price and realized slippage during both advances and pullbacks. A 300% order-count increase with stable, deep liquidity is a different volatility signal from the same increase hitting a thin book.
3. Check derivatives leverage
Open interest, perpetual funding, options skew and liquidation data can show whether spot activity is attracting leveraged followers. If open interest and funding rise faster than spot volume, the immediate risk may shift from “more demand” to “more crowded exposure.”
4. Compare BTC with ETH
Webull grouped Bitcoin and ether together, but the assets can respond differently to flows, staking narratives, ETF expectations and market beta. Track the ETH/BTC ratio and each asset’s spot breadth. A broad, orderly rotation is less fragile than a one-sided move concentrated in a single contract or venue.
5. Watch the next Webull disclosure
The next useful evidence would be a longer time series showing crypto trading volume, executed notional, active customers, deposits and net buying. Until then, the August 25 report is a timely observation rather than a complete flow dataset.
Use the LiveVolatile markets monitor, liquidations dashboard and Bitcoin volatility calculator to compare platform-reported activity with market-wide stress measures.
Does the PDT change make BTC or ETH bullish?
Not by itself. Removing a trading restriction can increase access and activity, but activity is not the same as durable accumulation. Greater access can produce more buying during a rally and more selling during a drawdown. The same rule change that increases upside participation can also shorten the time between momentum entry and forced or discretionary exit.
The bullish interpretation would require confirmation: sustained net deposits, rising executed spot volume, healthy market depth and a move that is not dependent on excessive leverage. The cautious interpretation would focus on the opposite setup: fast order growth, high funding, expanding open interest and deteriorating depth. That combination can make realized volatility larger in both directions.
The SEC’s separate June 11 proposal to rescind Rules 611 and 610(e) of Regulation NMS should not be confused with the PDT change discussed by Webull. The SEC proposal concerns U.S. equity-market structure, had an August 17 comment deadline, and is not evidence that the crypto order statistic was caused by that proposal.
FAQ
Did Bitcoin and ETH demand rise 300% across the market?
No. Webull reported a nearly 300% increase in buy-side orders on its own platform over roughly a week and a half. The report does not establish a 300% increase in global crypto demand.
What changed on June 4, 2026?
Webull’s August 19 results release said the Pattern Day Trader rule was eliminated on June 4, allowing eligible customers to place unlimited day trades. This article relies on Webull’s company-reported description of the implementation.
Does more retail trading always increase volatility?
No. More activity can improve liquidity in some conditions, but aggressive orders interacting with thin books or leverage can also increase realized volatility and reversal risk.
What data should traders monitor next?
Track multi-venue spot volume, order-book depth, spreads, funding, open interest, liquidations, ETH/BTC relative strength and any future Webull disclosure that separates crypto orders from executions and net flows.
Conclusion
Webull’s nearly 300% BTC and ETH buy-order increase is a meaningful retail-behavior signal because it follows a policy change that expanded trading access for eligible customers. But the right interpretation is narrower than the headline: it is platform-specific, company-reported and not yet a market-wide demand measure.
For volatility traders, the edge is in the verification step. If multi-venue spot participation, depth and net flows confirm the move, retail access may be adding durable activity. If leverage rises faster than liquidity, the same flow can increase two-way instability. Treat the Webull figure as a prompt to inspect market structure—not as a standalone bullish forecast.
Risk disclaimer: This article is for informational and educational purposes only. Crypto assets and securities are highly volatile and may lose some or all of their value. Nothing here is financial, legal or investment advice.
Sources
- Webull Reports Second Quarter 2026 Financial Results — Webull Corporation via PRNewswire, published August 19, 2026; reports the June 4 PDT-rule change, Q2 revenue and trading-related revenue.
- Webull Q2 2026 Earnings Conference Call transcript — Benzinga transcript hosted by Webull, published approximately five days before this article; provides company context including reported Q2 crypto revenue.
- Webull Sees Bitcoin, ETH Buy Orders Jump Nearly 300% After Rule Repeal — Darryn Pollock, BeInCrypto, published August 25, 2026 at 01:29 UTC; reports Anthony Denier’s CNBC interview and the buy-side-order statistic.
- SEC Proposes Rescission of Regulation NMS Rules 611 and 610(e) — U.S. Securities and Exchange Commission, June 11, 2026; cited only to distinguish the separate Rule 611 proposal from the PDT change.
Image credits: Original LiveVolatile SVG at /images/articles/2026-08-25-webull-retail-crypto-order-flow.svg; based on the cited Webull and BeInCrypto sources. No third-party image is reproduced.
— LiveVolatile Research Desk